


Stats and graphs - what are they all?
Top third ja percentages
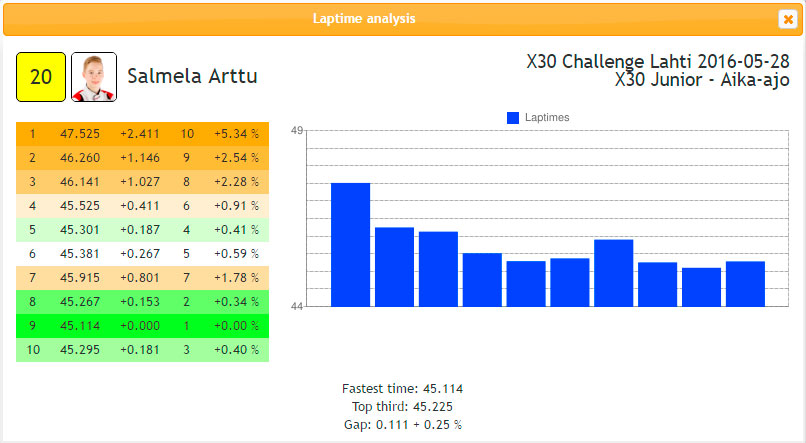
As we've showed before, you can check every driver's every lap time when you click their best lap time of a session on results page or on a driver's profile page. Below is an example from BirelART driver Arttu Salmela who drove X30 Junior class in Lahti. It's quite obvious that the best times are shown with green color and the worst with brownish orange. The darker the color is, the closer to the end of the value range, the lap time is. From the left the values are: lap number, lap time in seconds, gap to the best lap time, nth fastest lap time and gap to the fastest lap time in percentages.
You can see almost always a lot of comparisons in percentages in X30 results as you used to see in Formula One qualifyings, because it's more universal way to compare lap times from different tracks. Half a second on one circuit can be a second on another because the track nature is different. You can never compare different tracks perfectly but percentages are much more reliable approach than fractions of seconds. On the right, there's a bar graph indicating the speed from left to right. The lower the bar is, the better the lap time was. Below you can also see three more values: Fastest time, a strange Top third value and Gap. Top third is an average value of a third (33%) of lap times sorted by the time, of course. When that value is compared with the best time, the result value is gap in both seconds and as a percentage. The gap indicates consistency of a driver in a sessions which is quite interesting in a long run.
Score value
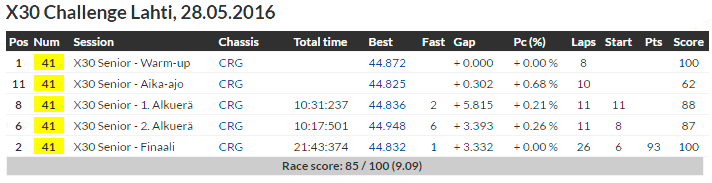
The columns on a result table vary a bit depending if you're watching them on a driver's profile page or in results section. Below you can see an example of CRG driver Elmeri Peippo's performance in Lahti. After the name or session name, there's chassis (if you click it, you go to team profile page), total time, best lap time (if you click, you can see all lap times), nth fastest lap time, gap to fastest (in warm-up or qual) or gap to first (in race), gap in percentages to fastest, number of laps, starting position, championship points and ranking score between 0-100.
So, there's a score value on the right. The principle is that the best in a session gets 100 points and the last doesn't get any points. It's quite brutal scale and it penalizes drivers from one position especially in small categories quite much in the beginning. The same scoring system is used for the nth fastest lap time. You can get additional points to the ranking score from gap to first in race session or from gained positions. In the future, you'll get points also from the consistency of you lap times and everything is affected by the number of opponents. In the end, all the scores from a race are calculated and balanced to an overall score of a race. The number in brackets is a Finnish school grade (4-10) of the same number.
The whole idea of the score system is to develop a value which can be used when comparing driver performances. In the long run when pilots drive different classes and get experience points, it makes it possible to compare the level of drivers in a grid or in races and rank them from one country and competition to another. The formula is universal and it will never be finished. It's continuously being developed and fine-tuned, so don't be surprised if a score from a session changes over time. A global ranking of karting drivers is needed and the work has begun from here. It's quite interesting, isn't it?
Bar graphs of sessions
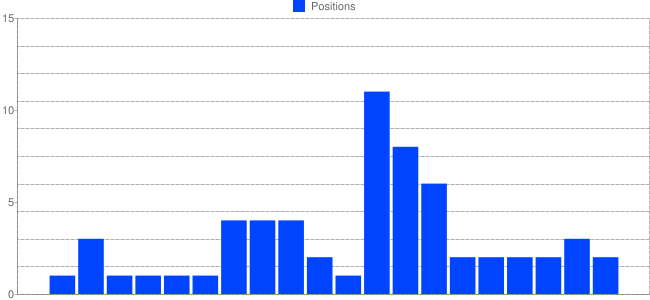
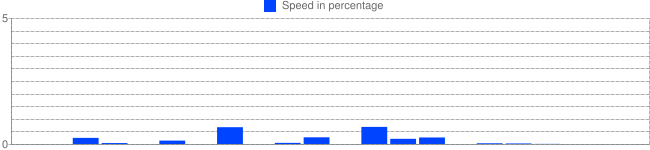
Below the results, there are two bar graphs indicating the performance in the past sessions. In the upper one, there's the position of a session where the lower the bar, the better. Time goes from left to right meaning that the latest result is on the right. In the lower graph, the best lap times in a session are compared with the fastest one in the same sessions, so you can see just the development of your speed. This graph is very interesting especially after a change, like after a changing a team or a chassis.
Statistics and performance indicators
The results page is developing continuously. Now on the front page, you can see the championship standings. Probably for the KF6 category, the points will still change because the Junior and Senior points are now counted as one category. This is a special license thing used almost solely in Finland. When you select a category from the menu on the left, you can see all races and sessions of the class. The usability of these pages will be developed next, unfortunately there's been too little time for that.
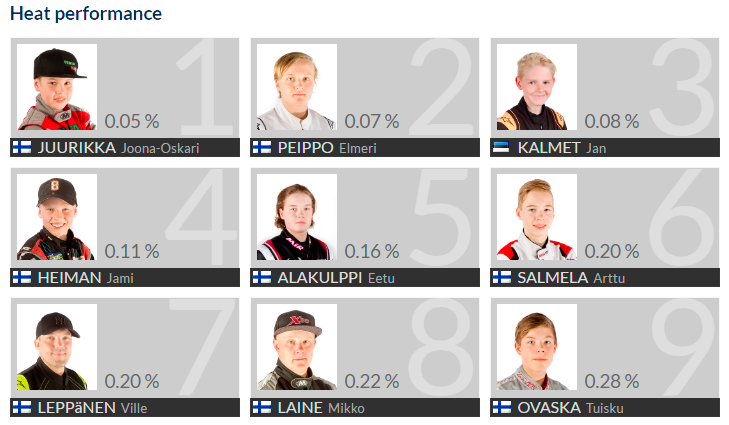
After classes you have statistics as follows: Most wins, Most podiums, Most poles, Most points, Most overtakes (gained positions in a race), Most laps, Qualifying performance, Heat performance, Final performance and X30 Ranking.
Drivers can earn special prizes from these values in the end of every season, so it's recommended to try to improve them if possible. If a driver participates in two categories, he/she gets most probably more laps and points. Luckily almost all have this possibility and on the other hand no-one can win everything, right? It's also interesting to see different people leading different stats. In performance indicators only the best lap times of a session are compared with the fastest and then averaged. For example, if a driver always qualifies on pole, the qualifying performance value is 0,00%.
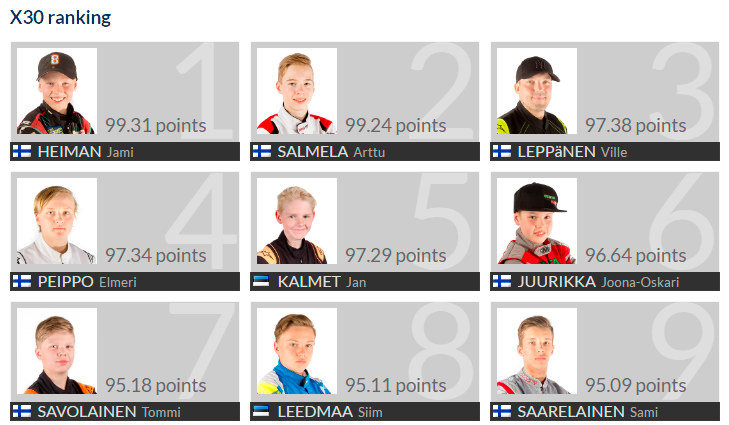
X30 Ranking
The results page looks generally very harmonic thanks to the photos which are all taken in the same environment and conditions. Huge thanks to our official photographer David Sarmas for his excellent work! X30 Ranking the first step to an impartial comparison of driver performances. The final ranking value drops some of the worst results automatically and calculates the overall score with a special formula. Also here the maximum score is 100 and drivers from different categories are successfully compared against each other. Warm-up results are ignored, because the legality of equipment can't be guaranteed. We're quite much into math and stats, so we want to develop these things and give you more fancy tools for studying data. If you have wishes and hopes, please tell them. We hope that you like these stats and you are waiting for more. Next we'll give you data about lead laps, lap positions and so on. Please share and stay tuned, and give us even more motivation!
Posted: June 7th, 2016